
3 Questions in 3 Minutes: Abacus FCF (ABLG) | Fei Xue
Abacus FCF International Leaders ETF (ABLG)
Abacus FCF International Leaders ETF (ABLG)
3 Questions in 3 Minutes: Abacus FCF (ABLG) | Fei Xue
Fund Investment Objective
The Abacus FCF International Leaders ETF (ABLG) seeks long-term capital appreciation by investing in international large- and mid-cap stocks that demonstrate robust Free Cash Flow Return on Invested Capital (FCF-ROIC) through a systematic approach.

Disciplined and consistent investment process
driven by quantitative models.
Access to “high quality” companies identified by
free cash flow research.
Fund Investment Objective
The Abacus FCF International Leaders ETF (ABLG) seeks to generate long-term capital appreciation by identifying the most profitable companies through a systematic approach.
Disciplined and consistent investment process
driven by quantitative models.
Access to “high quality” companies identified by
free cash flow research.
ESG considerations beyond company
fundamentals are an integral part of the “high
quality” decision.
Why Invest in ABLG?
- High Conviction Ideas: Focus on a select group of international market-leading companies with exceptional FCF-ROIC, demonstrating superior cash flow fundamentals for sustainable long-term returns potential.
- Disciplined Risk Management: Balance high-conviction, profitable and quality stock selection with a risk-adjusted, diversified portfolio construction with downside protection while capturing upside potential.
- Adaptive to Business Cycle: Utilizes dynamic allocation that continuously adapts to evolving global market conditions by reassessing FCF-ROIC leaders, ensuring the portfolio remains aligned with current opportunities.
- Proven Methodology: Backed by nearly 30 years of empirical validation and academic research, offering a time-tested, transparent and repeatable systematic investment process.
Fund Information
| EXCHANGE: | CBOE BZX Exchange, Inc. |
| TICKER: | ABLG |
| CUSIP: | 89628W401 |
| INCEPTION DATE: | June 27, 2017 |
| NET ASSETS AS OF 10/15/2026: | $14,055,039 |
| SHARES OUTSTANDING: | 475,000 |
| CLOSING PRICE: | $29.67 |
| NAV: | $29.59 |
| PREMIUM/DISCOUNT: | 0.28% |
| GROSS/NET EXPENSE RATIO: | 0.54% |
| 30-DAY SEC YIELD AS OF 9/30/2026: | 2.33%** |
| MEDIAN 30 DAY BID/ASK SPREAD: | 0.26% |
| **The 30-Day SEC Yield is computed under an SEC standardized formula based on net income earned over the past 30 days. | |
Why Invest in ABLG?
- High Conviction Ideas: Focus on a select group of international market-leading companies with exceptional FCF-ROIC, demonstrating superior cash flow fundamentals for sustainable long-term returns potential.
- Disciplined Risk Management: Balance high-conviction, profitable and quality stock selection with a risk-adjusted, diversified portfolio construction with downside protection while capturing upside potential.
- Adaptive to Business Cycle: Utilizes dynamic allocation that continuously adapts to evolving global market conditions by reassessing FCF-ROIC leaders, ensuring the portfolio remains aligned with current opportunities.
- Proven Methodology: Backed by nearly 30 years of empirical validation and academic research, offering a time-tested, transparent and repeatable systematic investment process.
Fund Information
| EXCHANGE: | CBOE BZX Exchange, Inc. |
| TICKER: | ABLG |
| CUSIP: | 89628W401 |
| INCEPTION DATE: | June 27, 2017 |
| NET ASSETS AS OF 10/15/2026: | $14,055,039 |
| SHARES OUTSTANDING: | 475,000 |
| CLOSING PRICE: | $29.67 |
| NAV: | $29.59 |
| PREMIUM/DISCOUNT: | 0.28% |
| GROSS/NET EXPENSE RATIO: | 0.54% |
| 30-DAY SEC YIELD AS OF 9/30/2026: | 2.33%** |
| MEDIAN 30 DAY BID/ASK SPREAD: | 0.26% |
| **The 30-Day SEC Yield is computed under an SEC standardized formula based on net income earned over the past 30 days. | |
Investor Materials
Investor Materials
Performance
QUARTER END PERFORMANCE (as of 09/30/2026)
Performance
QUARTER END PERFORMANCE (as of 09/30/2026)
| NAME | QUARTER | 1 YR | 3 YR | 5 YR | ANNUALIZED SINCE INCEPTION |
|---|---|---|---|---|---|
| ABLG (Market) | -7.20% | 0.45% | 7.15% | 0.97% | 4.74% |
| ABLG (NAV) | -7.01% | 0.48% | 7.26% | 0.89% | 4.76% |
| MSCI All Country World Index ex USA Growth | -2.47% | 17.30% | 5.46% | 12.85% | 7.70% |
| MSCI All Country World Index ex USA | 0.48% | 20.00% | 20.54% | 9.55% | 8.57% |
Expense Ratio: 0.54%. The performance data quoted represents past performance. Past performance does not guarantee future results. The investment return and principal value of an investment will fluctuate so that an investor’s shares, when sold or redeemed, may be worth more or less than their original cost and current performance may be lower or higher than the performance quoted. Performance current to the most recent month-end can be obtained by calling (toll free 800-617-0004). Short term performance, in particular, is not a good indication of the fund’s future performance, and an investment should not be made based solely on returns.
Top 10 Holdings (as of 10/15/2026)
Top 10 Holdings (as of 10/15/2026)
| TICKER | CUSIP | SECURITY DESCRIPTION | SHARES | MARKET VALUE | % OF NET ASSETS |
|---|---|---|---|---|---|
| TSM | 874039100 | Taiwan Semiconductor Manufacturing Co Ltd | 1782 | $752,449.50 | 5.35% |
| ASML | N07059210 | ASML Holding NV | 441 | $730,931.04 | 5.20% |
| ATEYY | 00762U200 | Advantest Corp | 2870 | $650,255.90 | 4.63% |
| 000660 KS | 6450267 | SK hynix Inc | 543 | $509,377.83 | 3.62% |
| NVS | 66987V109 | Novartis AG | 3088 | $464,373.44 | 3.30% |
| RYCEY | 775781206 | Rolls-Royce Holdings PLC | 23713 | $429,442.43 | 3.06% |
| RHHBY | 771195104 | Roche Holding AG | 7176 | $407,453.28 | 2.90% |
| 700 HK | BMMV2K8 | Tencent Holdings Ltd | 7510 | $399,828.99 | 2.84% |
| FRO | M46528101 | Frontline PLC | 7256 | $381,230.24 | 2.71% |
| SUBCY | 864323100 | Subsea 7 SA | 10964 | $378,696.56 | 2.69% |
Holdings are subject to change without notice.
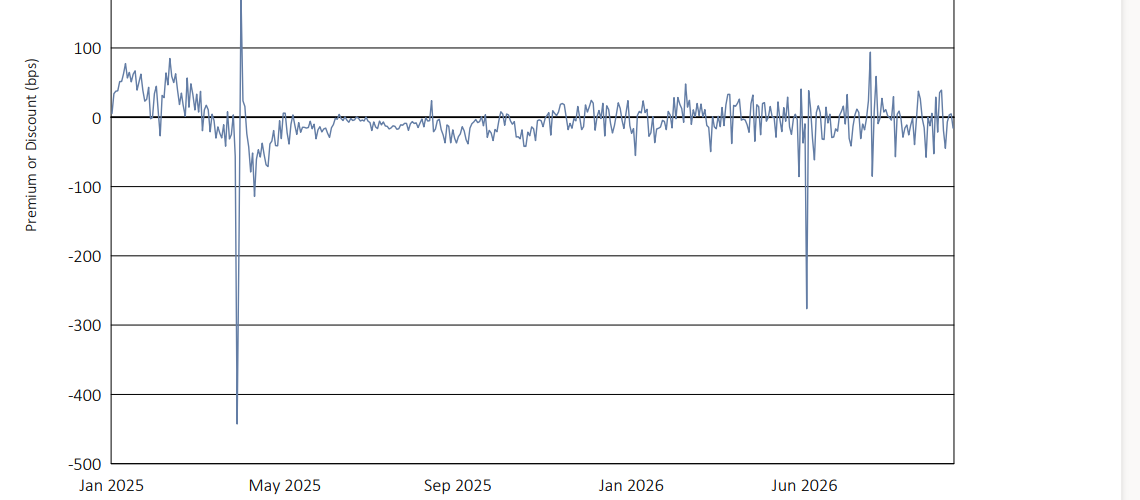
Premium Discount
Premium Discount
Abacus FCF International Leaders ETF (ABLG)
January 2, 2025 to September 30, 2026
Abacus FCF International Leaders ETF (ABLG)
January 2, 2025 to June 30, 2026
| 2025 | Q1 2026 | Q2 2026 | Q3 2026 | Q4 2026 | |
|---|---|---|---|---|---|
| Days traded at premium | 83 | 33 | 31 | 27 | N/A |
| Days traded at net asset value | 0 | 0 | 0 | 0 | N/A |
| Days traded at discount | 168 | 28 | 31 | 37 | N/A |
This table and line graph are provided to show the frequency at which the closing price of the Fund was at a premium (above) or discount (below) to the Fund’s daily net asset value (“NAV”). The table and line graph represent past performance and cannot be used to predict future results. Shareholders may pay more than NAV when buying Fund shares and receive less than NAV when those shares are sold because shares are bought and sold at current market prices.

| 2025 | Q1 2026 | Q2 2026 | Q3 2026 | Q4 2026 | |
|---|---|---|---|---|---|
| Days traded at premium | 83 | 33 | 31 | 27 | N/A |
| Days traded at net asset value | 0 | 0 | 0 | 0 | N/A |
| Days traded at discount | 168 | 28 | 31 | 37 | N/A |
This table and line graph are provided to show the frequency at which the closing price of the Fund was at a premium (above) or discount (below) to the Fund’s daily net asset value (“NAV”). The table and line graph represent past performance and cannot be used to predict future results. Shareholders may pay more than NAV when buying Fund shares and receive less than NAV when those shares are sold because shares are bought and sold at current market prices.
Distribution
DISTRIBUTION DETAIL
Distribution
DISTRIBUTION DETAIL
| EX-DATE | RECORD DATE | PAYABLE DATE | AMOUNT |
|---|---|---|---|
| 9/29/2026 | 9/29/2026 | 9/30/2026 | $0.16613343 |
| 6/29/2026 | 6/29/2026 | 6/30/2026 | $0.26157657 |
| 3/30/2026 | 3/30/2026 | 3/31/2026 | $0.24891824 |
| 12/30/2025 | 12/30/2025 | 12/31/2025 | $0.15230462 |
| 9/29/2025 | 9/29/2025 | 9/30/2025 | $0.09311808 |
| 6/26/2025 | 6/27/2025 | 6/30/2025 | $0.30552863 |
| 3/28/2025 | 3/28/2025 | 3/31/2025 | $0.17831563 |
| 12/30/2024 | 12/30/2024 | 12/31/2024 | $0.11827718 |
| 9/27/2024 | 9/27/2024 | 9/30/2024 | $0.19999412 |
| 6/10/2024 | 6/10/2024 | 6/11/2024 | $0.26360379 |
| 3/5/2024 | 3/6/2024 | 3/7/2024 | $0.02891920 |
| 12/27/2023 | 12/28/2023 | 12/29/2023 | $0.01893163 |
| 12/14/2023 | 12/15/2023 | 12/18/2023 | $0.11850113 |
| 9/6/2023 | 9/7/2023 | 9/8/2023 | $0.16440858 |
| 6/5/2023 | 6/6/2023 | 6/7/2023 | $0.38259734 |
| 3/3/2023 | 3/6/2023 | 3/7/2023 | $0.01093063 |
| 12/28/2022 | 12/29/2022 | 12/30/2022 | $2.36816586 |
| 12/30/2021 | 12/31/2021 | 1/3/2022 | $0.73352044 |
| 12/30/2020 | 12/31/2020 | 1/4/2020 | $0.20292472 |
| 12/30/2019 | 12/31/2019 | 1/2/2020 | $0.51465475 |
| 12/28/2018 | 12/31/2018 | 1/2/2019 | $0.20479334 |
| 12/28/2017 | 12/29/2017 | 1/2/2018 | $0.07160616 |

The MSCI All Country World Index ex USA (MSCI ACWI ex USA) is a market-capitalization-weighted index designed to measure equity market performance across developed and emerging markets, excluding the United States. It covers approximately 23 developed and 24 emerging market countries. It is not possible to invest directly in an index
Investing involves risk. Principal loss is possible.
Before investing you should carefully consider the Fund’s investment objectives, risks, charges and expenses. This and other information is in the statutory and summary prospectuses, a copy of which may be obtained by visiting the Fund’s website at www.abacusfcf.com/ABFL, www.abacusfcf.com/ABLG, www.abacusfcf.com/ABLD, www.abacusfcf.com/ABOT, www.abacusfcf.com/ABLS, www.abacusfcf.com/ABXB. Please read the prospectus carefully before you invest.
Opinions expressed are subject to change at any time, are not guaranteed and should not be considered investment advice.
Fund holdings are subject to change and should not be considered a recommendation to buy or sell any security. Please click here for top holdings. www.abacusfcf.com/ABFL, www.abacusfcf.com/ABLG, www.abacusfcf.com/ABLD, www.abacusfcf.com/ABOT, www.abacusfcf.com/ABLS, www.abacusfcf.com/ABXB.
ESG investing is defined as utilizing environmental, social, and governance (ESG) criteria as a set of standards for a company’s operations that socially conscious investors use to screen potential investments. A strategy or emphasis on ESG may limit the investment opportunities available to a portfolio. Therefore, the ABFL and ABLG ETFs may underperform or perform differently than other portfolios that do not have an ESG investment focus. The ABLD, ABOT and ABXB ETFs do not include an ESG component.
There is no guarantee that ABFL will achieve its investment objective. Investing involves risk, including the possible loss of principal. Because the Fund is an ETF (rather than a mutual fund), shares are bought and sold at market price (not NAV), may trade at a discount or premium to NAV, and are not individually redeemable. Owners of the shares may acquire those shares from the Fund and tender those shares for redemption to the Fund in Creation Unit aggregations only, consisting of 25,000 shares. Brokerage commissions will reduce returns. Investments in the Fund include risks associated with small-and mid-cap securities, which involve limited liquidity and greater volatility than large-cap securities.
There is no guarantee that ABLG will achieve its investment objective. Investing involves risk, including the possible loss of principal. Because the Fund is an ETF (rather than a mutual fund), shares are bought and sold at market price (not NAV), may trade at a discount or premium to NAV, and are not individually redeemable, consisting of 25,000 shares. Brokerage commissions will reduce returns. Investments in the Fund include risks associated with small-and mid-cap securities, which involve limited liquidity and greater volatility than large-cap securities. Returns on investments in foreign securities could be more volatile than investments in domestic securities.
There is no guarantee that ABOT will achieve its investment objective. Investing involves risk, including the possible loss of principal. Because the Fund is an ETF (rather than a mutual fund), shares are bought and sold at market price (not NAV), may trade at a discount or premium to NAV, and are not individually redeemable. Owners of the shares may acquire those shares from the Fund and tender those shares for redemption to the Fund in Creation Unit aggregations only, consisting of 25,000 shares. Brokerage commissions will reduce returns. Investments in the Fund include risks associated with small-and mid-cap securities, which involve limited liquidity and greater volatility than large-cap securities. Passive funds that seek to track an index may hold the component securities of the underlying index regardless of the current or projected performance of a specific security or the relevant market as a whole, which could cause the fund returns to be lower if the fund employed an active strategy.
There is no guarantee that ABLS will achieve its investment objective. Investing involves risk, including the possible loss of principal. Because the Fund is an ETF (rather than a mutual fund), shares are bought and sold at market price (not NAV), may trade at a discount or premium to NAV, and are not individually redeemable. Owners of the shares may acquire those shares from the Fund and tender those shares for redemption to the Fund in Creation Unit aggregations only, consisting of 25,000 shares. Brokerage commissions will reduce returns. Investments in the Fund include risks associated with small-cap securities, which involve limited liquidity and greater volatility than large-cap securities. The Fund’s focus on Free Cash Flow Return on Invested Capital (FCF-ROIC) as a selection criterion may limit the investment opportunities available to the portfolio and may cause the Fund to underperform or perform differently than other portfolios that do not use this methodology. There is no guarantee that the FCF-ROIC methodology will achieve its intended results or that the companies selected will maintain their cash flow characteristics over time.
There is no guarantee that ABXB will achieve its investment objective. Investing involves risk, including the possible loss of principal. Because the Fund is an ETF (rather than a mutual fund), shares are bought and sold at market price (not NAV), may trade at a discount or premium to NAV, and are not individually redeemable. Owners of the shares may acquire those shares from the Fund and tender those shares for redemption to the Fund in Creation Unit aggregations only, consisting of 25,000 shares. Brokerage commissions will reduce returns. Investments in the Fund include risks associated with small-and mid-cap securities, which involve limited liquidity and greater volatility than large-cap securities. Passive funds that seek to track an index may hold the component securities of the underlying index regardless of the current or projected performance of a specific security or the relevant market as a whole, which could cause the fund returns to be lower if the fund employed an active strategy.
There is no guarantee that ABLD will achieve its investment objective. Investing involves risk, including the possible loss of principal. Because the Fund is an ETF (rather than a mutual fund), shares are bought and sold at market price (not NAV), may trade at a discount or premium to NAV, and are not individually redeemable. Owners of the shares may acquire those shares from the Fund and tender those shares for redemption to the Fund in Creation Unit aggregations only, consisting of 25,000 shares. Brokerage commissions will reduce returns. Investments in the Fund include risks associated with small-and mid-cap securities, which involve limited liquidity and greater volatility than large-cap securities. Because the Fund invests in ETFs, an investor will indirectly bear the principal risks of the underlying funds, including illiquidity, and an investment in the Fund will entail more costs and expenses than a direct investment in the Underlying ETFs. Passive funds that seek to track an index may hold the component securities of the underlying index regardless of the current or projected performance of a specific security or relevant market as a whole, which could cause the Fund returns to be lower than if the Fund employed an active strategy. The performance of the Fund may diverge from that of its Index. Downside Protection Model Risk. Neither the Adviser nor the Sub Adviser can offer assurances that the downside protection model employed by the Underlying Index methodology will achieve its intended results, or that downside protection will be provided during periods of time when the Equity Portfolio is declining or during any period of time deemed to be a bear market. Investment in a fund that utilizes a downside protection model that seeks to minimize risk only during certain prolonged bear market environments may not be appropriate for every investor seeking a particular risk profile. The Fund’s investments in derivatives may pose risks in addition to and greater than those associated with investing directly in the underlying assets, including counterparty, leverage and liquidity risks. The Fund may participate in futures markets, which are highly volatile. The Fund’s investments in derivatives may pose risks in addition to and greater than those associated with investing directly in the underlying assets, including counterparty, leverage and liquidity risks. Active and frequent trading of portfolio securities may result in increased transaction costs to the Fund and may also result in higher taxes if Shares are held in a taxable account. REITs Risk. A REIT is a company that pools investor funds to invest primarily in income producing real estate or real estate related loans or interests. The Fund may be subject to certain risks associated with direct investments in REITs. MLP Risk. An MLP is a publicly traded partnerships primarily engaged in the transportation, storage, processing, refining, marketing, exploration, production, and mining of minerals and natural resources. MLP common units, like other equity securities, can be affected by macroeconomic and other factors affecting the stock market in general.
Market Price: The current price at which shares are bought and sold. Market returns are based upon last trade price. NAV: The dollar value of a single share, based on the value of the underlying assets of the fund minus its liabilities, divided by the number of shares outstanding. Calculated at the end of each business day.
We define “high-quality” companies as those exhibiting a strong and sustainable financial position, that have the potential to generate organic growth over the long-term.
Free Cash Flow (FCF) represents the cash that a company is able to generate after accounting for capital expenditures.
Opinions expressed are subject to change, are not guaranteed, and should not be considered investment advice.
Securities are distributed by Quasar Distributors, LLC & Regional Investment Services, Inc, Member FINRA.
© FCF Funds. All Rights Reserved.